
How to Calculate Your Website’s Ad Revenue? | Ad Revenue Calculator
In 2021, Setupad presented one of the industry’s most advanced and unmatched tools– the Yield Formula, available through our client dashboard.
Years of testing and our long-term vision resulted in a simple mathematical representation that shows our publishers what influences revenue growth, where it comes from, and how to unlock the full potential of the website’s power to generate ad revenue.
Today, we’re proud to introduce the public version of the Yield Formula – Ad Revenue Calculator, our free tool that offers uniquely precise website revenue estimate that was previously available only to Setupad clients.
Read on to learn more about the yield formula and how it can help you improve your monetization strategy and grow your ad revenue in the long run.
What is an Ad Revenue Calculator?
Ad Revenue Calculator is a tool that helps publishers estimate the potential revenue generated from display ads, taking into account metrics such as website traffic.
Setupad Ad Revenue Calculator is available for free to everyone who wants to estimate their website’s ad revenue.
Adjust the toggle values to see your projected website revenue. Connect your Google Analytics account to automatically import your website metrics for seamless insights.
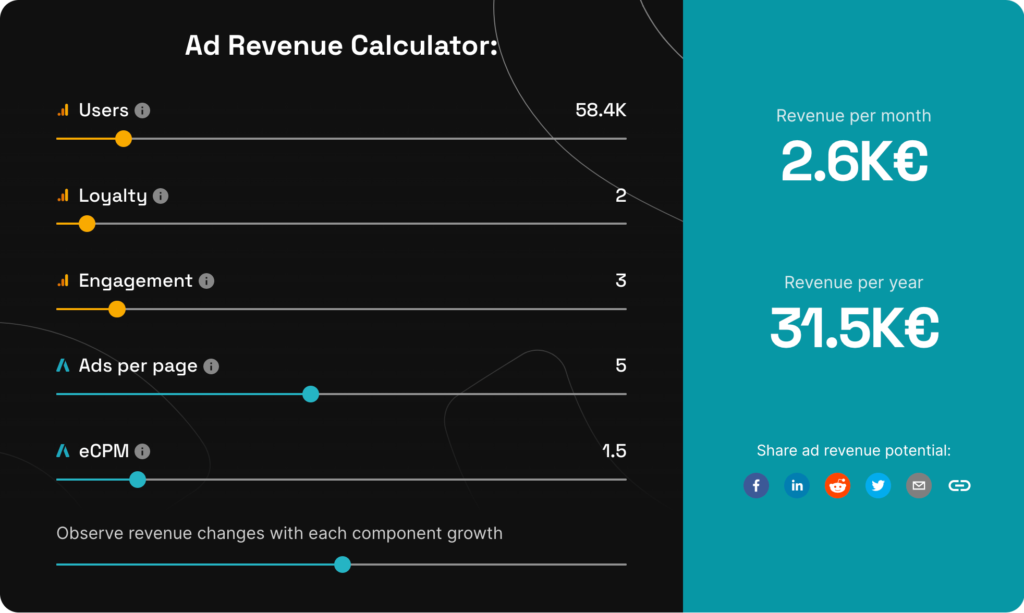
Ad revenue calculators may take into account different metrics depending on the use cases. Our ad revenue calculator is based on what we think is the most precise and all-encompassing formula–the yield formula. We pinned down the 5 most essential metrics that influence revenue performance for the publisher.
Three of these metrics look at the user behavior, while the other two at monetization strength, including tier (price) of your traffic geolocation. This presents the most comprehensive view of the ad revenue change.
What is the Yield Formula?
It’s a mathematical multiplication of the most important metrics in monetization:

With the yield formula, you can calculate your revenue potential and see how each component influences overall revenue. You will also be able to see how the compound effect may affect your revenue growth exponentially. All you need to do is to achieve small incremental growth for all the key metrics in the formula.
Overall website’s revenue depends on these key metrics:
- number of users;
- loyalty (number of sessions per user);
- engagement (pages per session);
- ads per page;
- eCPM.
If you connect your Google Analytics account, you will automatically see all current website metrics for more precise estimation.
Each metric represents a different strategy implementation, and we at Setupad help publishers grow these key metrics together. Our vast experience with hundreds of publishers over the years has helped us understand and learn different growth techniques, such as content distribution, content recirculation, marketing, loyalty growth strategies, improvements in website design and ad load speed, etc.
Now, let’s talk about features available to Setupad clients through our client dashboard.
What is Historical Projection?
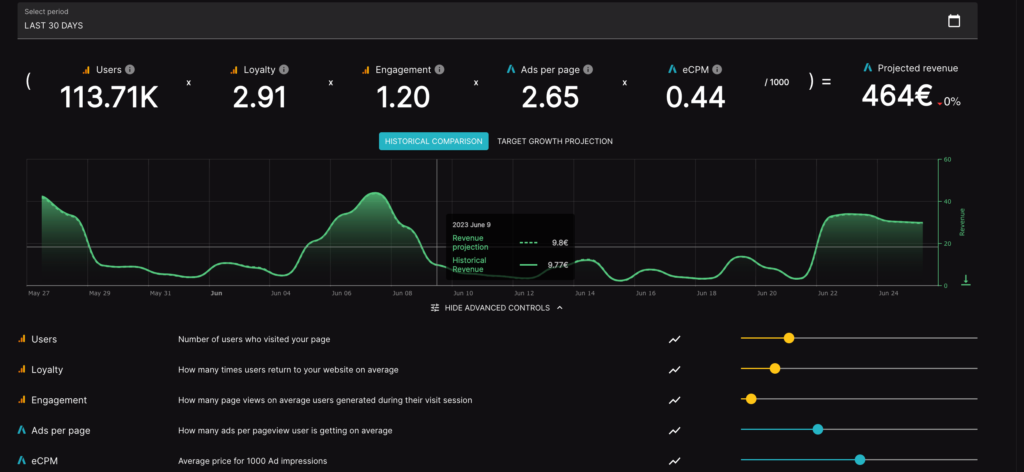
The historical projection and target growth projection is a feature available only to Setupad clients through our client dashboard. The historical comparison shows you 30-day historical data for your website’s ad revenue. When you change any of the toggles, it will show you the projection and the historical data.
It’s a useful feature to see how precise the yield formula is. Of course, there are more minor factors that we’re unable to predict, such as industry changes, buying power of demand partners, ad server discrepancies, and others.
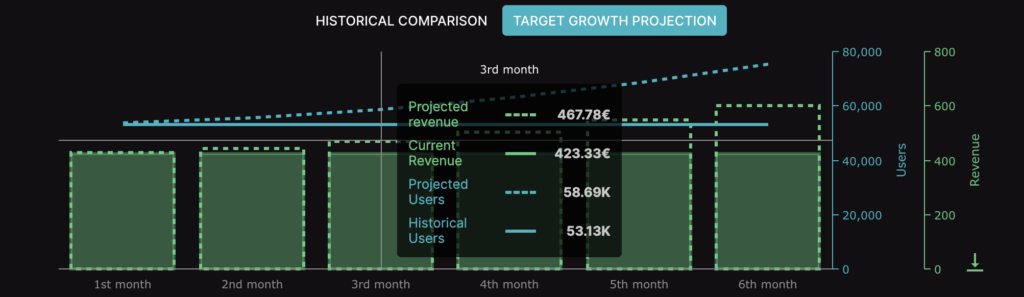
What is Target Growth Projection?
The target growth projection shows you how in the next 6 months, you will gradually reach the set target. We’ve chosen a time frame of 6 months to reflect on the fact that magic doesn’t happen overnight; it requires a long-term step-by-step approach.
How Can Publishers Grow Ad Monetization Performance?
- To grow their user base, publishers should focus on creating valuable and engaging content that resonates with their target audience. Besides, it’s important to implement SEO tactics in their content creation efforts.
- To enhance user loyalty, you need to keep users engaged by providing relevant and high-quality content. Tailoring content and recommendations to individual user preferences can help with that, especially if the publisher has access to first-party user data through login and email data. Publishers can also deliver personalized content through newsletters and targeted recommendations.
- To encourage user engagement, publishers should create content that uses catchy headlines, storytelling techniques, visuals, and interactive elements such as quizzes, polls, or surveys. Content recommendations could help too.
- To improve your eCPM, publishers should focus on optimizing ad viewability on each ad placement, as well as for the domain. In addition, you should test different ad formats to determine the best-performing ones for your ad inventory. Finally, it’s worth targeting high-value niches, working with premium demand partners through a monetization partner, and optimizing ad fill rates to achieve maximum eCPM values.
- To increase the number of ads per page, you need to have a solid understanding of user experience. There are various ways to find the perfect balance of ads per page, including A/B split tests, typography and website layout changes, and experiments with different ad formats. The most effective approach will depend on your website and the loyalty of your audience.
How to Use the Yield Formula?
By adjusting the sliders, publishers can see how the overall revenue will be influenced in the long run. Adjusting all metrics will allow us to see the more powerful compound effect on the graphs.
By moving the sliders up for any metric, like website visits, in the video example below, publishers can see how the overall revenue will be influenced in the long run. Moving more metrics up will allow us to see the more powerful compound effect on the graphs.
In the video example, in the last 30 days, the website received 53.13K users. Let’s imagine that the plan for the next 6 months is to increase the total users to 71.31K. By changing the toggle to the desired number, the publisher can see how the overall ad revenue will be influenced. In the example, the prediction shows that by growing the total number of users to 71.34K, the publisher will increase the overall ad revenue by 34% in the next 6 months.
Under the toggle, you can also see how your revenue changes when you grow each component by a certain %.
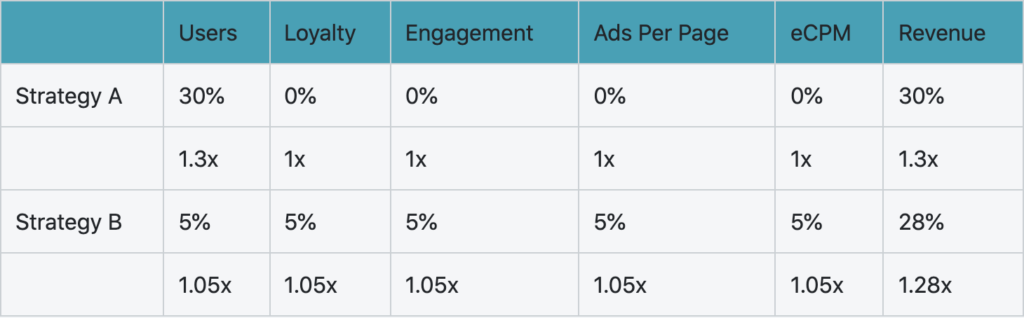
Almost the same revenue growth may be achieved by a smaller increase in all 5 metrics of the formula, for example, by 5% each. While some publishers would focus on user growth, others may apply a more diversified strategy to grow several metrics by a smaller increment to achieve a similar goal.
Below, we have attached an example where you can see that with strategy A, the publisher only grows one metric–users by 30%, thus increasing revenue by 30%. But in strategy B, the publisher decided to increase all metrics by 5% resulting in a revenue increase of 28%. Publishers can decide which strategy suits them best.
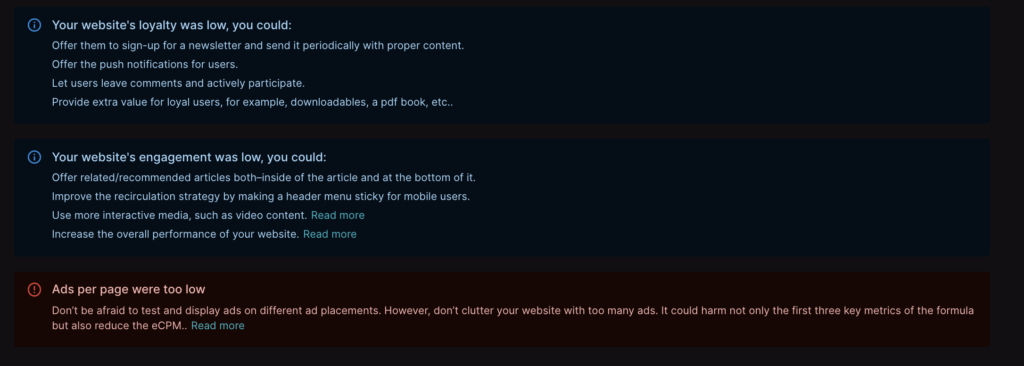
To make it easier for our clients, we have prepared customized suggestions for each of their websites to help them see which metric they could improve and how.
Final Words
As a company that prides itself not just on the most advanced monetization technology, one of our core values is to support publishers in their website optimization journeys, which includes ways to grow traffic, improve the user experience, and experiment with different revenue streams. Therefore, we are very keen on working with our publishers on strategies and ideas to improve their revenue in the long run.
In the future, we plan to include in our ad revenue calculator market benchmarks that will give publishers insights into how their websites are performing compared to other websites in the same verticals. Stay tuned!