
30 Marketing KPIs You Need to Monitor in 2025
As we move forward in 2025, the importance of crafting a marketing strategy that resonates with your audience and drives significant business growth has never been higher. However, a significant question remains–which KPIs are actually worth your attention?
With an overwhelming array of marketing KPIs available, focusing on the ones that truly matter is essential. Beyond the popular metrics like cost per lead, conversion rate, and website traffic, numerous other KPIs can significantly enhance your marketing strategy.
We’re here to help you out! This article simplifies the complexity by listing the top 30 Marketing KPIs you should monitor in 2025
What are Marketing KPIs?
Marketing KPIs are specific, quantifiable metrics used to evaluate the effectiveness and success of marketing actions. They help to understand how well the marketing campaigns achieve set objectives, ranging from increasing brand awareness to boosting sales.
The primary purpose is to optimize marketing strategies and ensure that resources are allocated efficiently to maximize the ROI. You can think of a KPI as the goal, and the marketing activities that take place as the tools that help to reach the goal.
Digital Performance Metrics
Website Traffic Metrics
Website traffic metrics measure the amount and type of activity on a website. These metrics include the number of visitors (new and returning), the pages they visit, how long they stay on the site, and how they found the site (e.g., through search engines, direct visits, or referral links).
You should know how much traffic a website gets, as these metrics help website owners understand how well their site is performing, identify trends in user behaviour, and pinpoint areas for improvement to attract more visitors and enhance user engagement.
Unique visitors
Unique visitors represent the number of individuals visiting your website within a given timeframe. Tracking unique visitors helps you understand the extent of your site’s reach and audience growth over time.
Page views
Page views indicate the total number of pages viewed on your website. High page views can suggest engaging content or effective site navigation, encouraging visitors to explore more of your site.
Time on site
Time on site, also known as “session duration,” is a metric that measures the average amount of time visitors spend on your website. Longer durations often indicate that your content is engaging and relevant to your audience’s interests.
SEO Performance
SEO performance refers to how well a website ranks on search engines (e.g., Google) and attracts organic traffic.
Organic search rankings
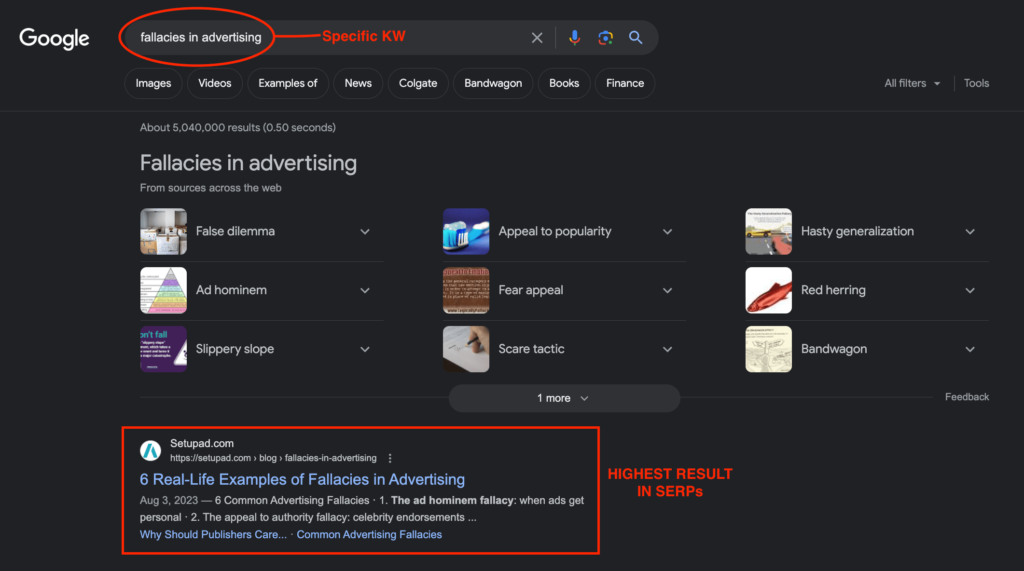
Organic search rankings refer to your website’s position on search engine results pages (SERPs) for specific keywords. Higher rankings can increase visibility and organic traffic, which is crucial for driving engagement and conversions.
Keyword performance
Keyword performance analyzes which keywords drive traffic to your site to help you understand your audience’s search intent and optimize your content strategy accordingly.
Backlink Profile
A backlink profile encompasses the quantity and quality of external sites linking to your website. A strong backlink profile can significantly enhance your site’s authority and improve organic search rankings.
For example, if your site receives a backlink from a source with high domain authority, it shows Google that your content is valuable.
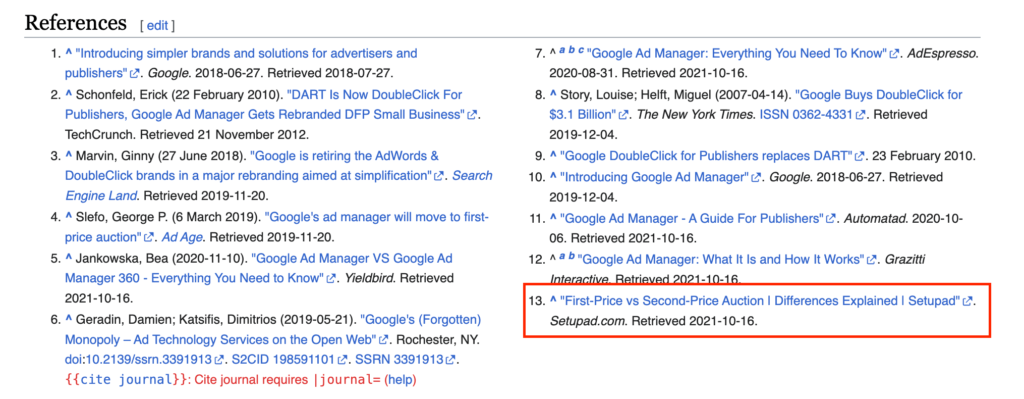
Source: Wikipedia
It is important to constantly monitor your backlink profile and analyze the backlinks you’re receiving to ensure a healthy backlink profile that wouldn’t cause any harm to your website.
Social Media Engagement
Understanding and tracking your social media performance data can help you create your content more wisely, connect with the right audience, increase engagement, and expand your follower base. In 2024, over half of the global population, totalling 5.04 billion individuals, are active users of social media platforms.
The easiest way to monitor your social media analytics is to use a program that collects crucial data from all social media platforms and provides tailored advice on getting the most out of your efforts (e.g., Buffer analytics tool).
Follower growth rate
The follower growth rate tracks how your social media followers increase. A steady growth rate can indicate effective content strategies and brand popularity.
Engagement rate (likes, comments, shares)
The engagement rate measures how actively your audience interacts with your content. High engagement rates often reflect content relevance and a strong connection with your audience.
Conversion rate from social channels
Conversion rate from social channels measures the percentage of social media interactions that lead to a desired action, such as a sale or a subscription.
Content Marketing KPIs
Content Reach
Content reach is the number of people businesses can engage through their content (e.g., blog posts, articles, and videos). Content reach is a crucial part of a company’s online presence and represents opportunities for companies to engage with consumers.
Impressions and views
The impressions and views metric quantifies how often your content has been displayed (impressions) and viewed (views). It helps to measure the initial level of exposure your content is getting, whether on social media, your website, or other platforms.
Share of voice in the industry
Share of voice measures your brand’s visibility and presence compared to competitors. A higher share of voice indicates greater brand awareness and authority.
It’s calculated based on how often your brand is mentioned or featured across various media and platforms in relation to your competitors.
Source: Prebid
User Interaction
User interaction is how the user acts with your system, which includes your customer service, website, product or software. Poor user interaction will result in a negative user experience. That’s why investing in a good customer support management software, alongside optimizing your website’s interface and refining your product or software usability, is crucial.
Click-through rates (CTR)
Click-through rates (CTR) are the percentage of people who click on a link to your content out of the total number who see the link.
This metric allows you to evaluate the effectiveness of your content’s titles, images, and CTAs in compelling users to take the next step.
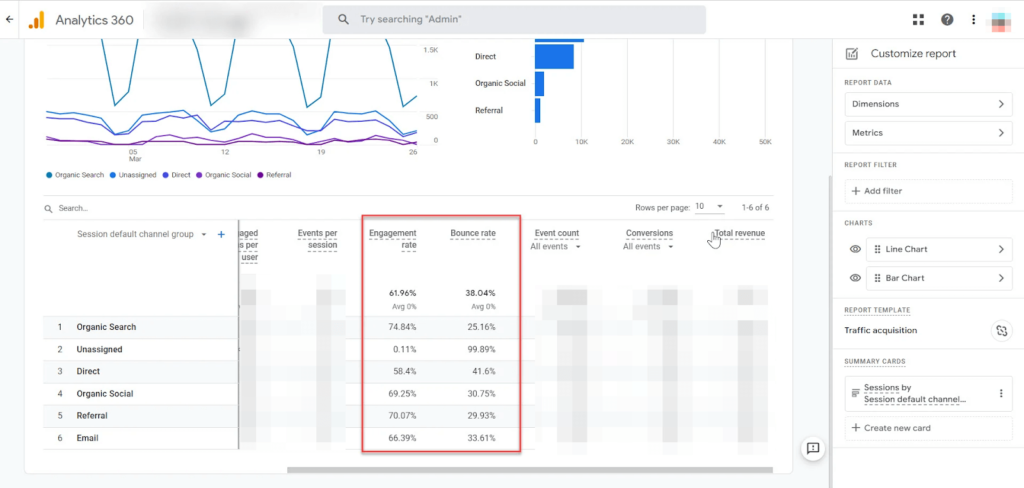
Bounce rate for content pages
Bounce rate measures the percentage of visitors who leave your website after viewing only one page without taking action.
Note: A high bounce rate on content pages can indicate that the content doesn’t meet the visitors’ expectations or isn’t engaging enough to keep them interested. It’s either because the page’s quality is low, or the audience coming to the page doesn’t match the page’s purpose.
Content ROI
Content ROI is a percentage showing how much revenue you gained from content marketing in comparison to what you spent.
- (return – investment ÷ investment) x 100 = ROI.
Lead generation from content
The amount of leads created directly from your content marketing efforts is tracked by lead generation from content.
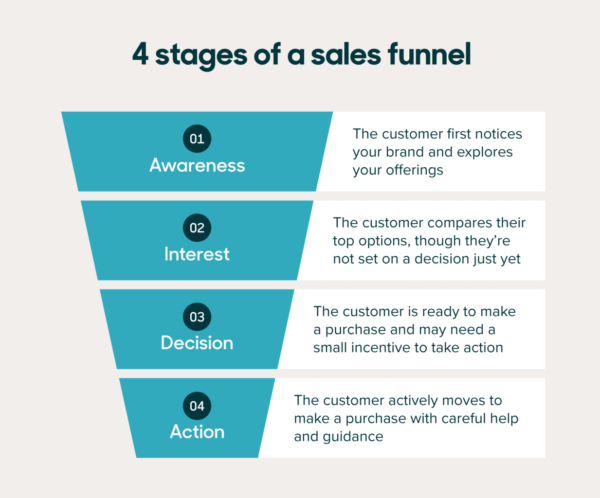
It helps to evaluate how well your content moves consumers through the sales funnel stages—from first awareness to expressing interest in your goods or services.
Source: Zendesk
Content conversion rates
Content conversion rates measure the percentage of content viewers who take a desired action (e.g., signing up for a newsletter, downloading a file, or purchasing).
It’s a key indicator of how well your content persuades your audience to engage further with your brand.
Advertising and Promotional Metrics
Paid Advertising Performance
Paid advertising is a strategy where, e.g., companies spend money to display their ads to specific target groups. Although this term can include traditional platforms like TV or radio, it mainly refers to digital ads on the web.
The process typically involves an auction system where advertisers compete for ad space on digital platforms like Google Ads. The platforms’ algorithms make decisions on which ads get displayed and their timing based on the competitive bids (programmatic advertising).
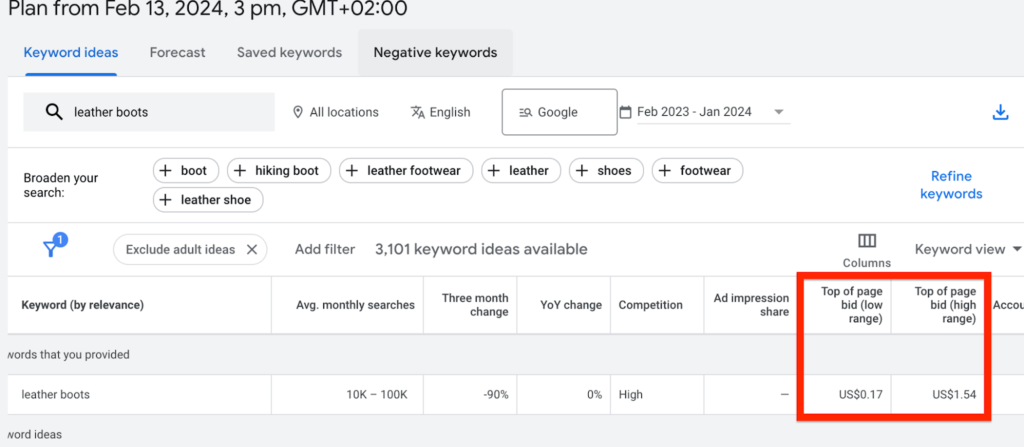
Cost Per Click (CPC)
Cost per click (CPC) measures the cost of each click on your paid ads. It’s calculated by dividing the total cost of your ad campaign by the number of clicks it received.
CPC is a key metric for understanding how much you pay for your website or landing page traffic, helping you manage your advertising budget effectively.
Return on Ad Spend (ROAS)
Return on ad spend (ROAS) measures the revenue generated for every dollar spent on advertising. It’s calculated by dividing the revenue generated from the ad campaign by the cost of the campaign.
Note: A higher ROAS indicates a more efficient and profitable advertising effort, showing you’re getting more return from your ad spend.
Ad Conversion Rates
Ad conversion rates measure the percentage of ad clicks that result in a desired action (e.g., a purchase, sign-up, or download). It’s calculated by dividing the conversions by the total number of clicks and multiplying by 100 to get a percentage.
Note: High ad conversion rates indicate that your ads effectively persuade users to take the desired action.
Email Marketing Effectiveness
Email marketing integrates with broader advertising and promotional strategies by providing a direct channel to measure engagement and conversion effectiveness.
Simply put, email marketing campaigns offer valuable insights that enhance the understanding of overall marketing performance. They give a holistic view of how different promotional efforts contribute to achieving business objectives.
Open Rates
Open rates indicate the percentage of email recipients who open a campaign. It’s calculated by dividing the number of opened emails by the total number of emails sent (excluding those that bounced), then multiplying by 100.
Note: A high open rate suggests your email subject lines are compelling and your audience is engaged with your brand.
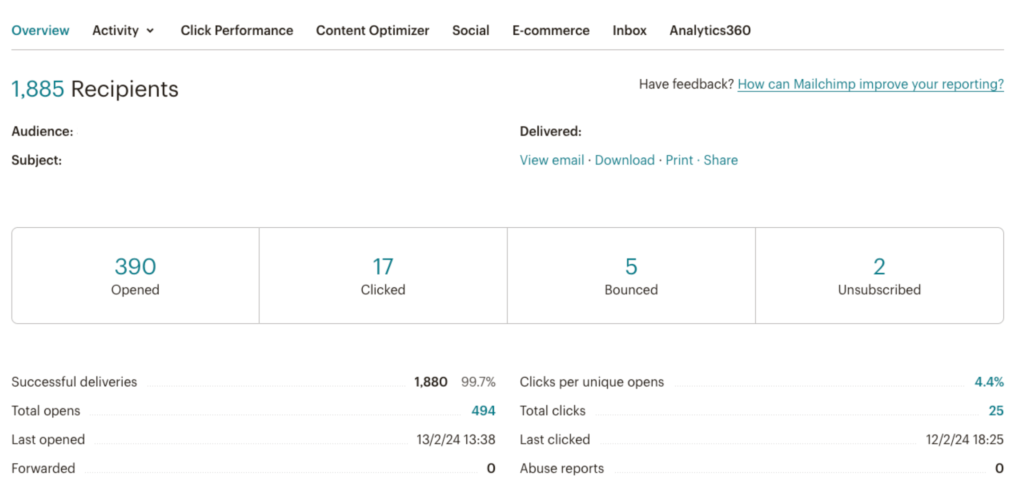
Click Rates
Click rates, or click-through rates (CTRs), measure the percentage of email recipients who click on one or more links in an email. It’s calculated by dividing the number of clicks by the number of delivered emails, then multiplying by 100.
Click rates help to assess the effectiveness of your email content and CTAs.
Conversion Rates from Email Campaigns
Conversion rates measure the percentage of email recipients who take a desired action after clicking on a link in the email (e.g., filling out a form). It’s calculated by dividing the conversions by the total number of delivered emails and multiplying by 100.
Note: High conversion rates from email campaigns indicate that your emails successfully drive recipients to action.
Sales and Revenue Focused KPIs
Lead Generation Metrics
Lead generation metrics can be used to analyze customer behavior patterns and identify potential customers who are most likely to convert.
Number of leads generated
The number of potential clients (leads) found over a certain period is tracked by the number of leads generated. It’s a key sign of how well your marketing campaigns are working to generate interest in your products or services.
Lead to customer conversion rate
The lead-to-customer conversion rate measures the percentage of leads that become paying customers. It’s calculated by dividing the number of new customers acquired by the number of leads generated, then multiplying by 100.
Note: A higher conversion rate indicates more efficient and effective sales and marketing processes.
Customer Acquisition Cost (CAC)
Customer acquisition cost (CAC) calculates the total cost of acquiring a new customer, including all marketing and sales expenses. It’s determined by dividing the total acquisition costs by the number of new customers over a specific period.
Generally, monitoring CAC helps businesses understand the value of acquiring new customers and manage their marketing budgets effectively.
Customer Lifetime Value (CLV)
Customer lifetime value (CLV) estimates the total revenue a business can expect from a single customer account throughout its relationship with the company.
It helps businesses understand the long-term value of acquiring and retaining customers, guiding decisions on how much to invest in customer acquisition and retention.
Revenue Growth
Revenue growth is the rate of increase in total revenues divided by total revenues from the same period in the previous year. It’s typically measured as a percent increase from a starting point.
Year-over-year growth
Year-over-year growth measures the growth in revenue from one period to the next, typically on an annual basis. It’s a critical indicator of the business’s overall financial health and the effectiveness of its growth strategies.
Revenue per channel
Revenue per channel breaks down revenue generation by different channels, such as sales, online, direct marketing, etc. It helps to understand which channels are most effective at generating revenue, allowing for a more targeted and efficient allocation of resources.
Customer Engagement and Satisfaction Metrics
Net Promoter Score (NPS)
Net promoter score (NPS) is a widely used metric that measures customer loyalty and the likelihood of customers recommending a company’s products or services to others.
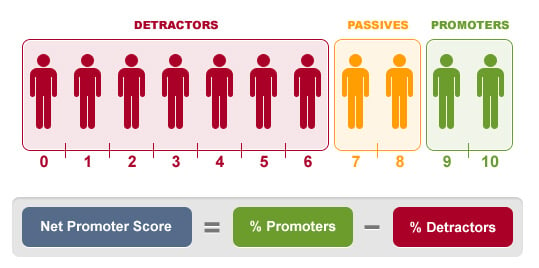
It’s calculated based on responses to a single question–on a scale of 0 to 10, how likely are you to recommend our company/product/service to a friend or colleague?
Based on their ratings, respondents are categorized into:
- Promoters (score 9-10)
- Passives (score 7-8)
- Detractors (score 0-6)
The NPS is then calculated by subtracting the detractors’ percentage from the promoters’.
The score can range from -100 (if every customer is a detractor) to 100 (if every customer is a promoter). A higher NPS indicates that customers are more likely to act as advocates for the brand, reflecting high customer satisfaction and loyalty. Many companies use NPS software to calculate and track this metric.
Source: Checkmarket
Customer Retention Rates
Customer retention rates measure the percentage of customers who remain with a company over a specific period. It’s a crucial indicator of how successfully a company keeps clients.
Retention rates are calculated by dividing the number of customers at the end of a period by the number of customers at the start of the period, minus new customers acquired, and then multiplying by 100.
Note: A high retention rate suggests that customers are satisfied with the company’s products or services and see ongoing value in them, which is critical for long-term success.
Customer Satisfaction Index (CSI)
The customer satisfaction index (CSI) measures customer satisfaction with a company’s products or services.
It’s usually obtained from survey data, in which respondents indicate their satisfaction with various factors, including overall experience, service effectiveness, and product quality. These ratings are then averaged to produce an index score, which can be tracked over time to monitor changes in customer satisfaction.
Note: Greater customer satisfaction, as indicated by a higher CSI, can result in more devoted customers and enhance word-of-mouth recommendations.
How to Select and Track the Metrics that are Important for You?
Selecting and tracking the right marketing KPIs requires a customized approach based on each project’s scope and strategic focus.
Clearly defining your goals is the key to determining which KPIs to rank first.
For example, it is crucial to select KPIs that directly affect sales results if the goal is to increase sales by 10% in a quarter. This avoids getting distracted by indicators that have less impact, such as social media likes.
This emphasizes how crucial it is to keep your KPI monitoring focused and avoid the trap of pursuing a wide range of indicators, which can be time-consuming and minimally beneficial.
Integrating KPIs into Business Strategy
Once you’ve selected the KPIs to track, leveraging the insights they provide involves a systematic approach encompassing 6 essential steps:
- Align KPIs with corporate objectives. Begin by ensuring that each KPI you monitor is directly linked to your organization’s goals. Understand what each KPI represents and its significance to your company’s success.
- Set clear targets. Establish specific, quantifiable targets for each KPI that align with your organizational objectives. These targets should be realistic and measurable, providing a clear benchmark for success.
- Define responsibility. Determine who within your organization will be accountable for monitoring each KPI and driving the actions needed to meet the set targets.
While it’s common for individuals to be responsible for a single KPI, overseeing up to three KPIs in smaller organizations might be practical.
- Monitor and collect data. Consistently track and gather data for each KPI. Some KPIs offer immediate insights (e.g., real-time metrics, CTRs, conversion rates), whereas others require accumulating data over several months to discern meaningful trends (e.g., Y-O-Y growth, CLV).
- Analyze and act. Equip your team with the necessary tools to review their KPI data regularly and improve team effectiveness. This analysis is critical for identifying areas that need adjustment and implementing changes to improve performance.
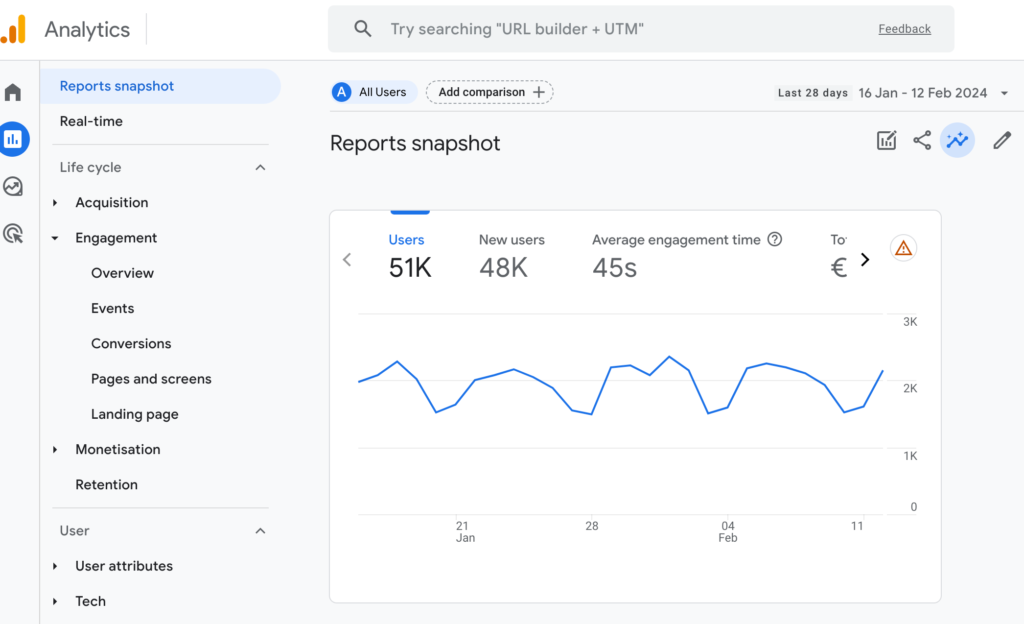
For example, Google Analytics 4 helps to track key marketing metrics like how many people visit your website, what they do there, and where they come from. It shows if your marketing efforts are working by tracking actions users take.
- Review and adjust. Periodically reassess your KPIs to ensure they align with your goals and effectively guide you toward your desired outcomes. Adjust your KPIs to stay on course towards achieving your objectives.
Conclusion
Analyzing different marketing KPIs is essential for any business aiming to refine its marketing strategy and achieve outstanding results. In 2025, businesses can navigate the large sea of data with purpose and clarity simply by focusing on indicators that provide significant insights.
By aligning KPIs with specific strategic goals, it becomes easier to optimize resources together with results.
Understanding and analyzing the right marketing KPIs is more crucial in 2025 than ever, especially for companies looking to drive growth and maintain a competitive edge in their respective markets. Stay informed and stay ahead!
FAQs
What are the top 3 KPIs every marketer should monitor in 2025?
The top 3 KPIs every marketer should monitor in 2025 are website traffic, conversion rate, and customer acquisition cost (CAC). These 3 KPIs offer a comprehensive view of a marketing strategy’s effectiveness–from initial attraction to final conversion, while also considering the cost-effectiveness of these efforts.
How do changes in technology affect marketing KPIs?
Changes in technology can introduce new platforms and tools for engagement, requiring marketers to adapt and possibly redefine their KPIs to stay relevant and effective.
What is the best way to track and analyze these KPIs?
The best way to track and analyze these KPIs is by using digital analytics platforms, like Google Analytics, which offer comprehensive insights into marketing performance.
How often should KPIs be reviewed and adjusted?
KPIs should be reviewed and adjusted quarterly to ensure they remain aligned with evolving business goals and market conditions.
How can small businesses effectively monitor these KPIs?
Small businesses can effectively monitor these KPIs by focusing on a few critical metrics directly impacting their goals and using free or low-cost analytics tools tailored to their scale and scope.