
How to Generate Reports in Google Ad Manager?
Google Ad Manager (GAM) is an ad server. It’s a platform that enables publishers to create, manage, and monitor their web, mobile app, and video ad inventory.
GAM reporting is one of the reasons it’s so popular among publishers. Ad Manager’s reporting function offers advanced forecasting and revenue optimization in addition to serving ads.
In this article, you’ll learn what Google Ad Manager reports are, how to use them, and why they’re essential for your advertising strategy.
How to Set Up Google Ad Manager?
There are 2 ways to get started with Google Ad Manager.
- Applying for GAM with an existing Google AdSense is required. Note you must comply with Platforms program policies and Google Publisher Policies. Google will review your application, and you will be approved to open an account if all the requirements are met.
- Sign up with an authorized GAM partner, like Setupad. This method helps to speed up the approval process.
Create an account in Google Ad Manager (GAM)
Here are the 3 main steps to create a GAM account:
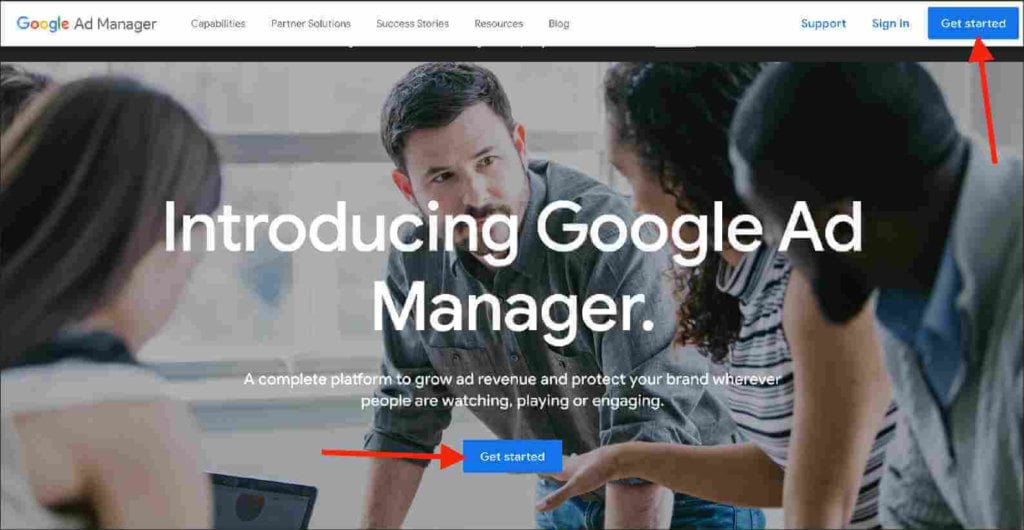
- Go to admanager.google.com and click “Get started.”
- Fill in the required prompts to complete the sign-up process.
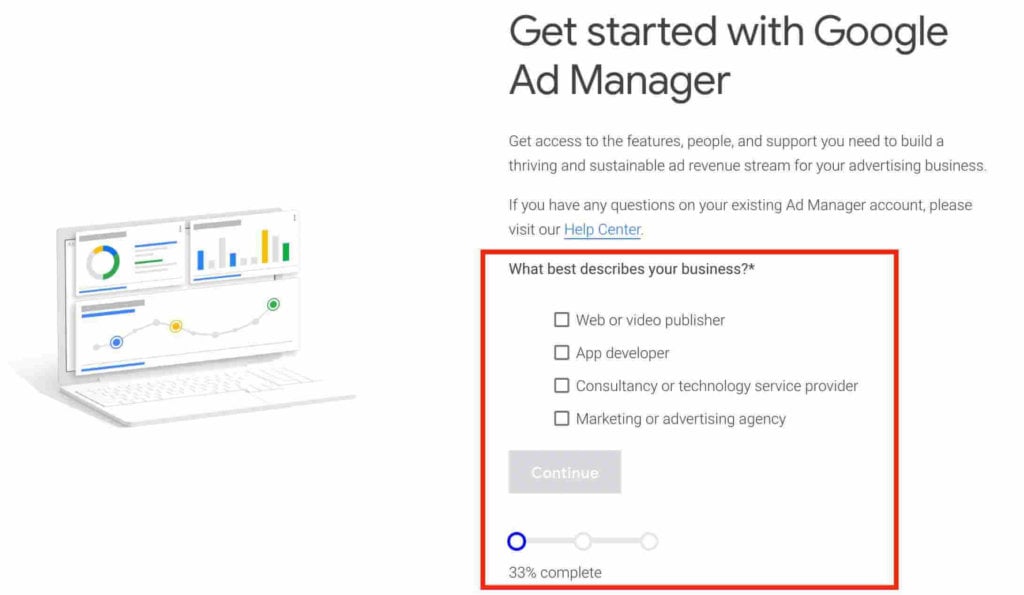
- Submit and wait for a response from a GAM representative.
Types of Reports in Google Ad Manager
With Google Ad Manager reports you can evaluate the performance of all your demand partners, inlcuding Ad Exchange (AdX) and AdSense. You can also gain insightful information to increase ad revenue and yield management.
These reports can be scheduled by day, week, and month. GAM allows filters based on dimensions and metrics. And if you are new to GAM reporting, you can start with predefined templates.
Additionally, you can share these reports with your team within the dashboard or save them as a CSV or Excel (XLS) file.
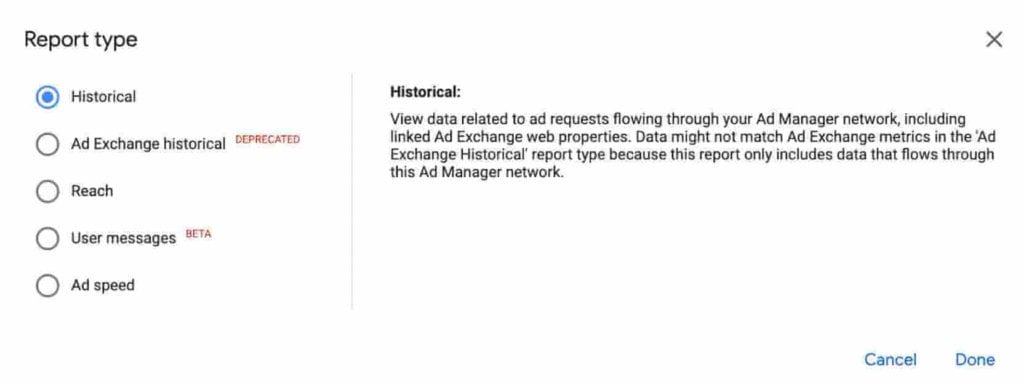
There are 5 main report types in GAM, such as:
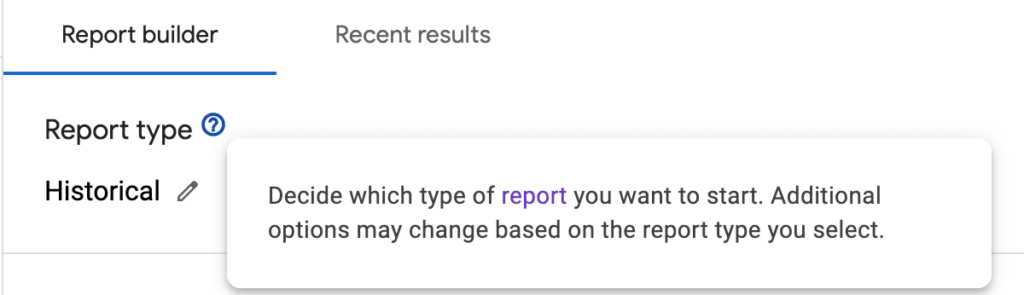
- Historical. It’s the most popular and default report in GAM. It lets you view your network’s historical performance (e.g., clicks, revenue, click-through rate, total impressions).
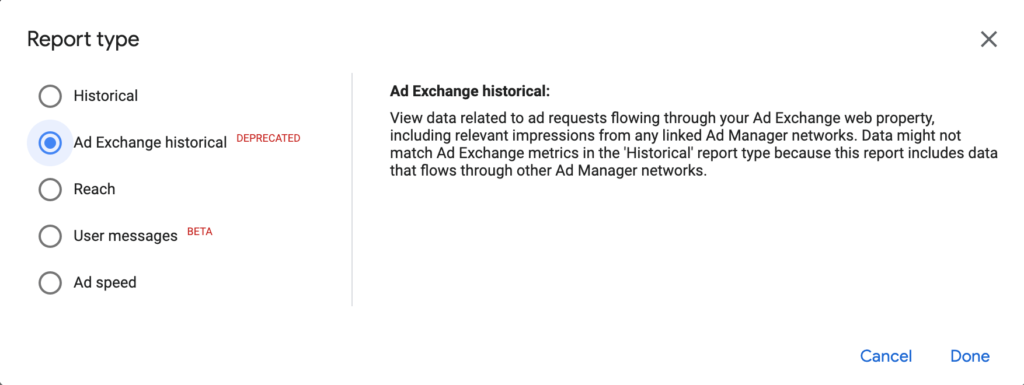
- Ad Exchange historical. Provides a combined view of the performance of publishers’ primary ad exchange account linked to the GAM server. It enables checking how other line items or demand partners compete with the AdX in the auctions. Whatsoever, the ad exchange historical report will be deprecated in May 2023. Due to this, many dimensions and metrics from this report have been transferred to the historical report.
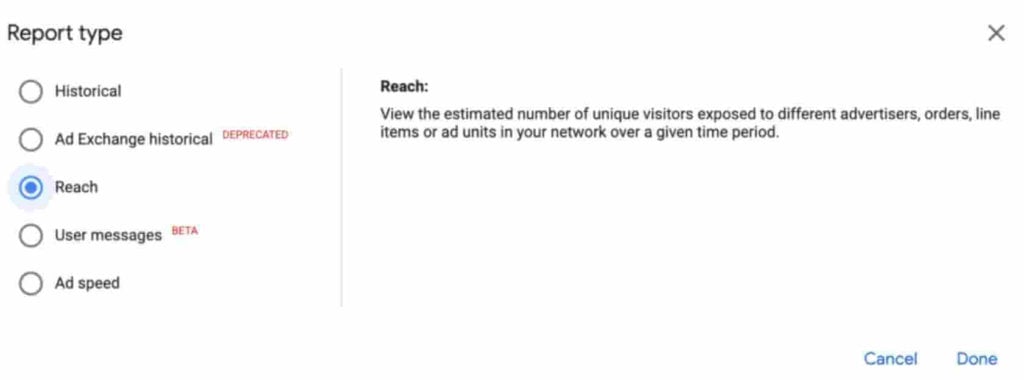
- Reach. This report enables you to see the number of unique visitors, orders, line items, or ad units in your network over a chosen time period.
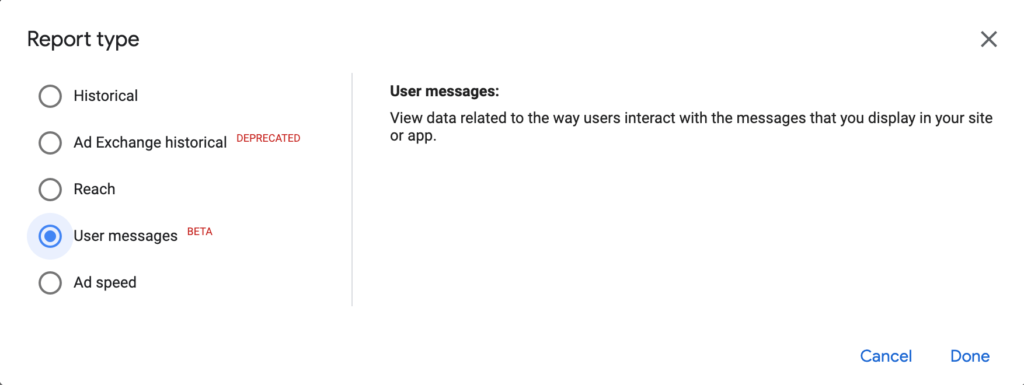
- User messages. Enables you to view how users interact and respond to messages within your site or app.
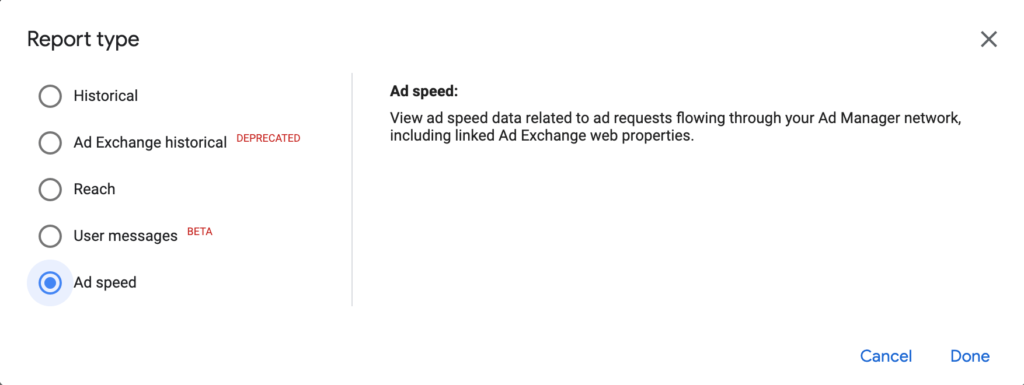
- Ad speed. Enables to see ad speed and rendering time data related to ad requests within GAM network and linked AdX web properties. It’s a beta version but allows you to discover heavy-loading ads and speed-related performance issues.
- Future sell-through (only in GAM360). Enables a publisher to check the availability of ad impressions in GAM. It displays the number of forecasted, available, and reserved ad impressions to improve the sell-through rate.
- Partner finance (only in GAM360). This report helps publishers monetize their content on the website of the host publishing partner. It helps the publishers to track assignments, and revenue splits between the two.
How to Generate Reports in GAM?
Here are the 11 main steps to generate a GAM report:
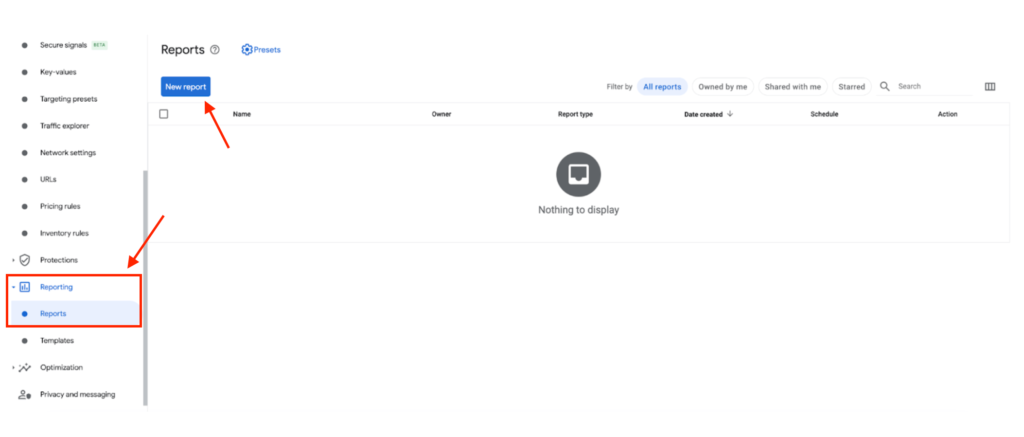
- Sign in to GAM.
- Click on “Reporting,” then “Reports.”
- Click “New report.”
- Select the report type you want to use and click “Done.”
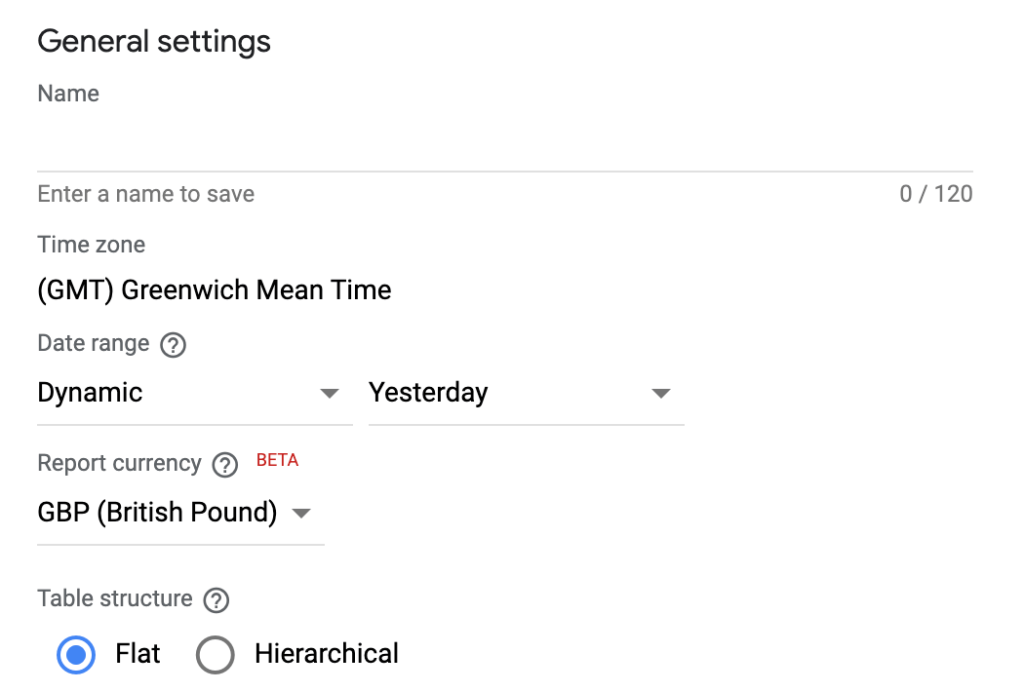
- Create a name for your report.
- Select the appropriate time zone.
- Select a date range.
- Choose a report table structure.
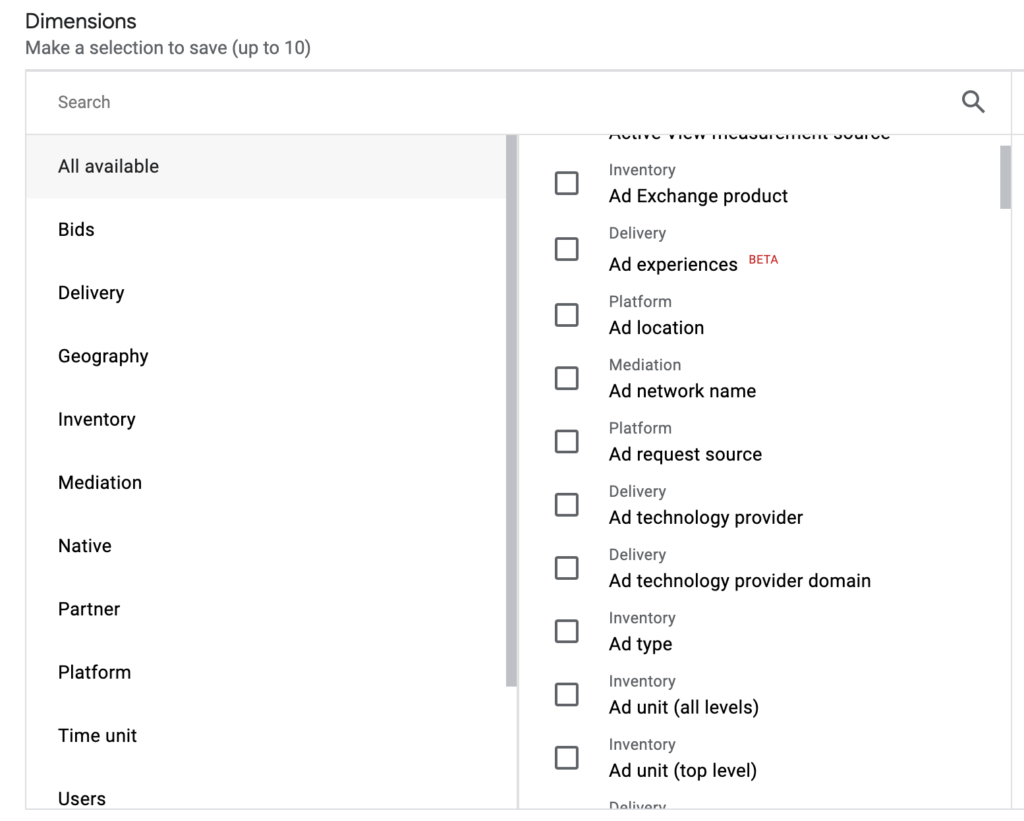
- Select dimensions to group and organize the data in your report.
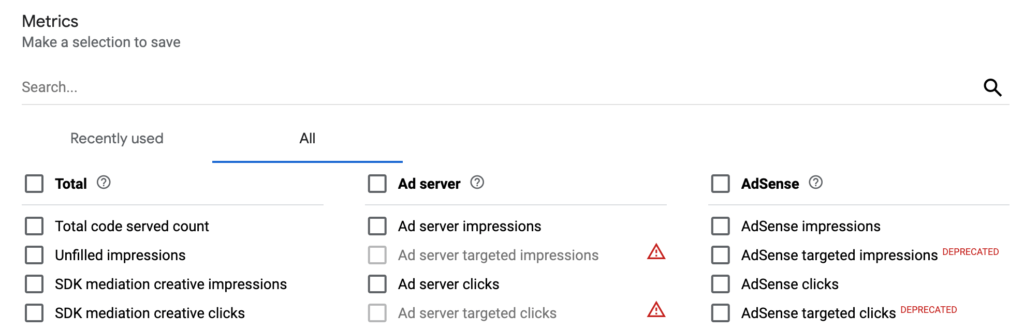
- Select metrics to determine what data should be displayed in the report.
- Save and run your report.

Set the date range
There are 3 options for the date range selection:
- Dynamic date range. Enables to display data over a rolling time period (e.g., “Last 30 days” or “Last 6 months”) and works best for scheduled reports.
- Custom date range. Enables you to set a custom dynamic date range (e.g., a start date of “6 weeks before today” and an end date of “1 day before yesterday”).
- Fixed date range. It can be a static date range of no more than 90 days for reports with a “Date” dimension or one year for reports with a “month and year” dimension.
Select the structure for your report
There are 2 report structures available:
- Flat table. It’s a simple spreadsheet with rows and columns.
- Hierarchical table. It’s a table with each dimension showing aggregated data within.
Select the dimension attributes
Dimensions are elements used by your ad server, exchange, and network (e.g., delivery, inventory, etc.).
Adding dimensions makes your reports easier to understand. The dimensions are grouped by category in the user interface, and you can search the list to find a specific dimension.
Select the metrics for your report
Metrics help to measure a dimension (e.g., CTR, impressions, ad requests, etc.).
You should only select the necessary metrics because increasing the number of them will increase the complexity of the data and may make it harder to understand.
Generate a report using a template
Templates offer pre-selected criteria (e.g., report type, metrics, dimensions) that help to start a new report. They can be generated on a one-time, daily, weekly, or monthly basis.
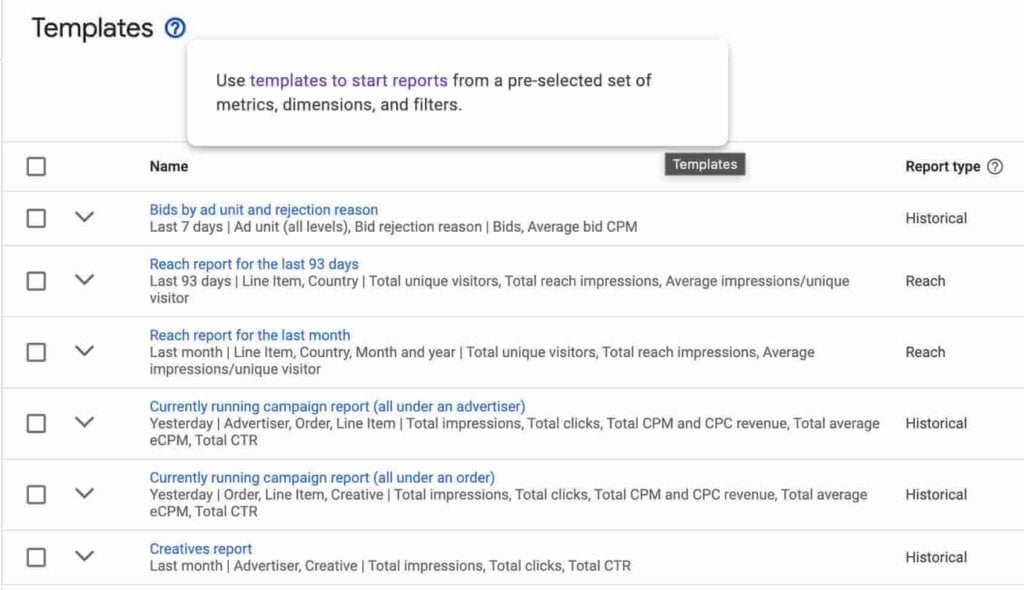
These pre-made templates are great starting points for new reports if you’re a beginner. The generated report can be set to run automatically at predetermined periods.
How to Interpret the Report Data?
To better understand the report data, you should be familiar with the key concepts and patterns of the displayed information.
Here are 5 key metrics explained:
- Total impressions–number of impressions from the GAM server, AdSense, AdX, and yield group partners.
- Total ad requests–the sum of all ad requests. For single ads, each request is counted once.
- Total CTR (total clicks / total impressions x 100)–a percentage showing how often users click on the ad they see. Total CTR is updated nightly and accounts for all impressions and clicks across GAM, AdSense, and AdX.
- Total fill rate–number of total impressions / number of total ad requests.
- Total unmatched ad requests–the number of requests where no ads were selected for display.
Identifying trends and patterns
You should look for patterns and trends in your data, such as spikes or drops in traffic, changes in CTRs, or differences in engagement rates between audience segments.
Identifying these patterns and trends can help you understand what’s driving the performance of your campaigns and where you need to optimize them.
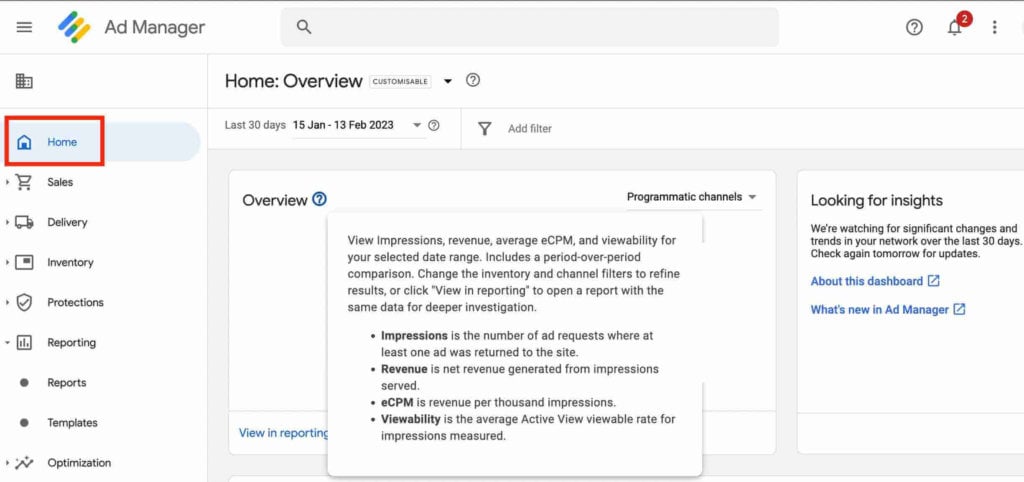
Use the home dashboard
The home dashboard helps to view and visualize your most significant data trends and KPIs, enabling you to comprehend the vital information of your ad campaigns easily. It compares your data to industry benchmarks and acts in response to those insights.
You can use the home dashboard to:
- View, analyze, and take action on your income, content, and audience’s most important performance metrics.
- Use GAM suggestions to optimize your ad campaigns.
- Establish and implement a comprehensive yield strategy, and manage and optimize your ad operations.
8 Best Practices for Report Generation in Google Ad Manager
1. Define your goals.
Before generating any report, clearly define your goals and what you want to achieve. This will help you select the appropriate metrics and dimensions for your report.
2. Choose the right date range.
When generating your report, choose the right date range. This will ensure you analyze data relevant to your goals and ad campaigns.
3. Use custom dimensions and metrics.
As we already mentioned above, GAM allows you to create custom dimensions and metrics to help you analyze data specific to your needs.
Use these custom dimensions and metrics to create more meaningful reports.
4. Segment your data.
Data segmentation can make spotting patterns and trends in your report easier.
The ability to separate data by dimensions like device, location, and audience allows you to examine these elements thoroughly.
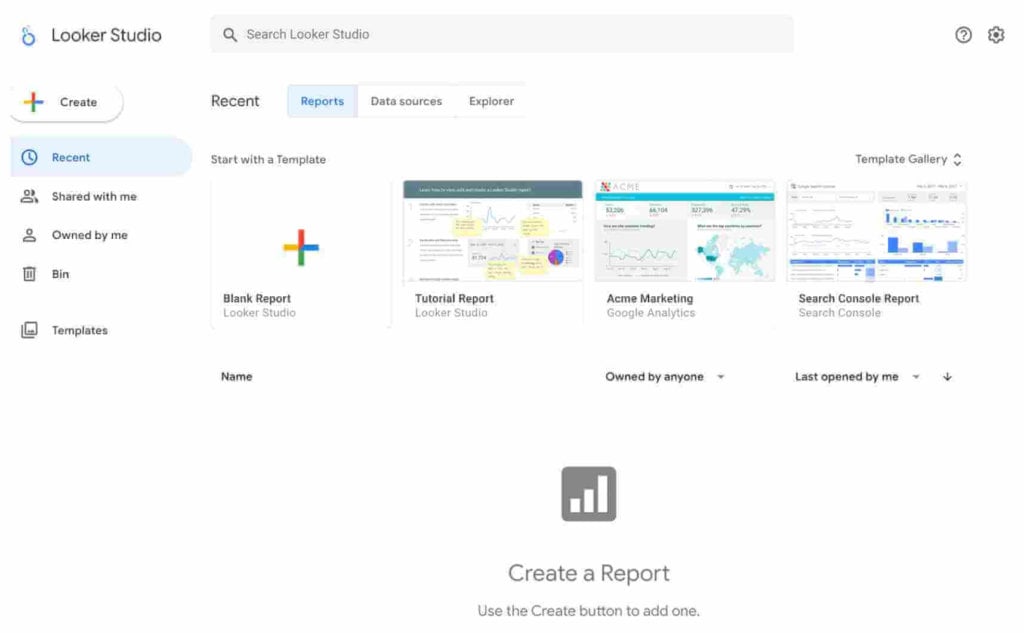
5. Use visualization tools
GAM offers a variety of visualization tools that can help you to analyze data more effectively. You can use charts, tables, and graphs to display your data in a way that is easy to understand.
For example, Google Looker studio is an open-source data visualization platform that allows combining data from many locations into one place to create a report that is easy to understand.
6. Monitor key performance indicators
You should monitor your key performance indicators (KPIs) regularly. For example, impressions, CTR, and engagement rate.
This will help you to identify any issues that require your attention so you can take action accordingly.
7. Take action based on your report results.
After analyzing your data, taking action based on the results is essential.
Whether it’s optimizing your campaigns, adjusting your targeting, or changing your creatives, you need to use the insights from your reports to make appropriate decisions.
8. Keep a regular reporting schedule
GAM enables you to set a reporting interval (e.g., daily, weekly, monthly) depending on the level of detail and the volume of campaigns you need to track.
Additionally, you can set up custom alerts for specific performance metrics. This can help you to identify potential issues earlier.
Conclusion
Google Ad Manager reports offer valuable insights into ad performance and help optimize ad campaign strategy. To make the reporting process easier, it’s crucial to familiarize yourself with the user interface and all the available features.
You can overview ad performance, auction insights, geography, search keywords, and essential KPIs to ensure that you receive efficient results and spot potential issues ahead of time.
Setupad can help you with the entire process of setting up your GAM account. We can take care of your ad inventory management and enable you to focus more on content creation.
Send us a message at [email protected] or sign up!