
How to Use Interactive Reports in Google Ad Manager and What’s New
Google Ad Manager is replacing its legacy reporting system with Interactive Reports, introducing a new way to analyze data.
Interactive Reports delivers more than a visual update. It fundamentally changes how AdOps teams build reports, explore data, and make rapid decisions.
What Are Interactive Reports?
Interactive Reports is Google Ad Manager’s new reporting environment designed for real-time data exploration.
Instead of generating static reports and exporting them for analysis, you can now:
- Build reports dynamically
- Modify them instantly
- Analyze data directly inside the interface
- Create reports with the help of Gemini AI
The goal is simple: reduce the time between data → insight → action.
The Timeline
Google has set a strict phase-out schedule for the old reporting tab. Here are the 3 dates publishers need to know:
- March 2, 2026: The “New report” button in the legacy tool has been permanently disabled. You are now automatically redirected to Interactive Reports to create a new dashboard.
- April 6, 2026: Google Ad Manager will automatically change all scheduled legacy reports to “unscheduled.” Automated email deliveries and data pipelines will stop running entirely.
- May 4, 2026: All features in the legacy Reports tool and the legacy API endpoints will be permanently deactivated.
How Interactive Reports Actually Work
The biggest change is not the interface; it’s the underlying workflow. Legacy reports were limited, static, and slow, often resulting in errors. Simple tasks like changing a dimension or adjusting the date range required rerunning the entire report, making the analysis time-consuming. With interactive reports, data updates instantly, AdOps teams can swap filters and dimensions, and insights are available in real time, giving them a faster and more flexible way to explore and act on data.
Advanced Interactive Reports Features That Change Data Analysis
Real-Time Data Interaction in Interactive Reports
Once a report is loaded, you can:
- Add or remove dimensions
- Change metrics
- Apply filters
- Adjust date ranges
All updates happen instantly, without rerunning the report.
The system processes all updates instantly, eliminating the need to rerun the query. This functionality empowers AdOps teams to move away from fixed reporting and continuously explore their data.
Comparison Tables (Quick Change Analysis)
Comparison tables allow you to analyze how metrics change over time within the same report.
You can:
- Compare different date ranges (e.g., today vs yesterday, week-over-week)
- View absolute and percentage changes
- Identify performance shifts across dimensions
For example:
- Revenue by ad unit (this week vs last week)
- Fill rate by country (before vs after a change)
Which makes it easy to:
- Get a quick overview of performance differences without rebuilding reports
- Spot sudden drops or spikes
- Evaluate the impact of optimization changes


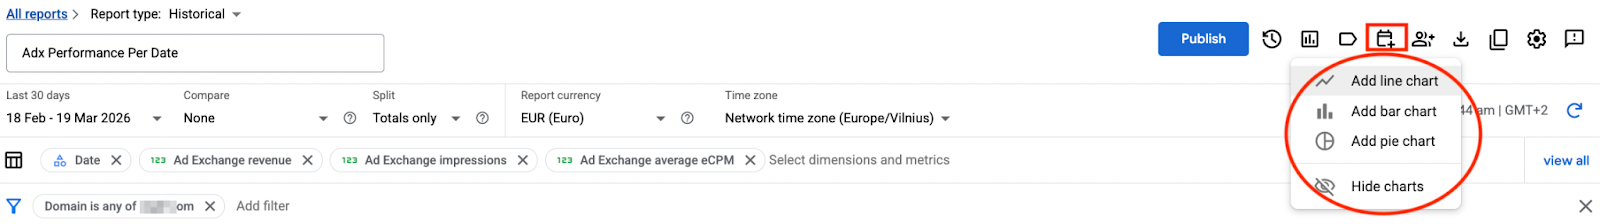
Charts (Visual Trend Analysis) for Interactive Reports
Interactive Reports also includes built-in charting capabilities for visual analysis.
You can:
- Visualize trends over time
- Compare performance across dimensions
- Identify patterns more quickly than in tables
Charts are particularly useful for:
- Monitoring revenue trends
- Spotting gradual performance declines
- Presenting data to stakeholders
By combining charts with filters and comparisons, you can quickly move from raw data to clear insights.

Gemini AI-Assisted Interactive Reports
One of the biggest new additions is AI-powered report creation.
Instead of manually selecting dimensions and metrics, you can use natural language prompts. For example: “Show last week’s revenue and unfilled impressions by ad unit.”
Interactive Reports will automatically:
- Select the correct dimensions
- Apply relevant metrics
- Build the report structure

In addition, the system can:
- Suggest relevant metrics based on your query
- Help users discover additional dimensions or metrics that may reveal insights or revenue opportunities you might not have considered.
Gemini AI significantly reduces the time required to build complex reports and makes the tool more accessible to less technical users.
Proactive Monitoring via Custom Flags
Custom Flags automatically highlight important changes in your data.
Instead of manually scanning reports, you can define thresholds such as:
- Revenue drops below a certain level
- Fill rate decreases beyond a set percentage
When your data meets these conditions, the system:
- Visually flags the metrics directly in the report.
- Alerts can be triggered (if configured with scheduling)

This feature transforms reporting from reactive analysis into proactive monitoring.
Smart Scheduling and Alerts in Interactive Reports
Interactive Reports still supports scheduled reports, but with more flexibility than the legacy system.
You can:
- Schedule reports to run at regular intervals
- Receive notifications when reports are ready
- Or trigger alerts only when your data meets specific flag conditions.


Instead of receiving the same reports every day, teams can:
- Focus only on meaningful changes
- Reduce unnecessary reporting noise
- Act faster when performance drops
Faster Report Setup with Search
Even without AI prompting, report creation is faster:
- You can search for metrics and dimensions directly
- No need to navigate long dropdown menus
This makes building and modifying reports much more efficient, especially for complex setups.
How to Create an Interactive Report
Here’s how to use Interactive Reports in practice:
1. Navigate to Interactive Reports
- Go to Reporting → Interactive Reports in Google Ad Manager
2. Create a New Report
- Click Create report
- Select the report type (e.g., Historical)

3. Add Metrics and Dimensions
Use the search to find what you need:
- Metrics: revenue, impressions, fill rate
- Dimensions: ad unit, line item, geography

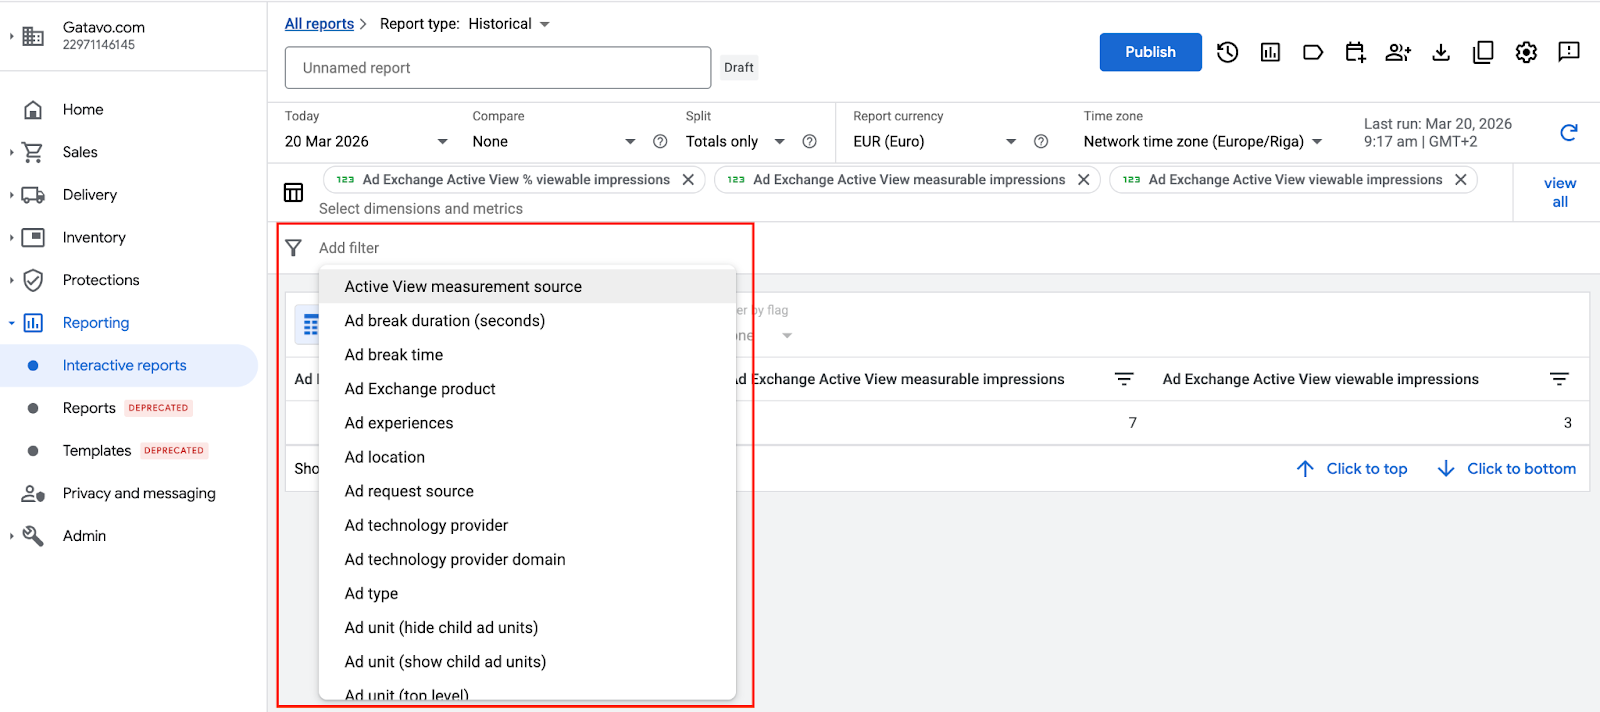
4. Apply Filters
Filter your data by:
- Device
- Country
- Demand source
- Inventory
5. Analyze and Adjust in Real Time
This is where Interactive Reports stand out:
- Modify the structure instantly
- Add breakdowns
- Change time ranges
No reruns required.
6. Publish or Schedule
- Save reports for reuse
- Schedule them for delivery
- Optionally set alerts for key changes
What’s New Compared to Legacy Reports
Here are the most important differences:
| Feature | Legacy Reports | Interactive Reports |
| Output/Editing | Fixed output, required rerunning for changes | Live, editable reports, instant updates |
| Workflow | Build → wait → export → analyze | Build → analyze instantly in one place |
| Speed/Iteration | Slow iteration, multiple report runs | Immediate adjustments, faster insights |
| Analysis | Limited in-platform analysis, heavy Excel dependency | Built-in comparisons, Pivot-style views, Real-time filtering |
| Use Case | Focused on exporting data | Focused on decision-making and optimization |
When to Use Interactive Reports
Interactive Reports are most useful when you need fast answers. Typical use cases:
Daily Monitoring
- Revenue trends
- Fill rate
- Demand partner performance
Troubleshooting
- Sudden drops in performance
- Latency or delivery issues
- Demand inconsistencies
Optimization
- Comparing SSP performance
- Identifying high-value inventory
- Analyzing user segments
What This Means for Publishers and AdOps Teams
The shift to Interactive Reports is more than a product update – it changes how AdOps teams can work with data. Legacy reporting has long been inflexible, and the industry has welcomed this change, as the last major overhaul of Google Ad Manager reporting was many years ago. Interactive Reports transforms reporting from a static, backward-looking task into a dynamic, real-time decision-making tool.
For publishers, this means one thing: the faster you can understand your data, the faster you can optimize your revenue. With Google Ad Manager receiving increased attention from Google and multiple functionality updates rolling out between 2025 and 2026, staying ahead is more important than ever. Join the Setupad network of clients and be among the first to leverage these new features and insights.